Thibaut Démare - LITIS
thibaut.demare@univ-lehavre.fr
thibaut.demare@univ-lehavre.fr
A Systemic Approach with Agent-based Model and Dynamic Graphs to Understand the Organization of a Logistic System
Colloque International Devport
Le Havre, France
May 19-20, 2016
Le Havre, France
May 19-20, 2016
A Systemic Approach with Agent-based Model and Dynamic Graphs to Understand the Organization of a Logistic System
Thibaut Démare
Cyrille Bertelle, Antoine Dutot and Laurent Lévêque
LITIS and UMR-IDEES - Université du Havre
Colloque International Devport - Le Havre, France
May 19-20, 2016
Overview
- Context
- Model
- Implementation
- Results
Context
How do we define a logistic system?
- It is a geographical territory composed of urban areas and of logistic structures.
- These structures support organised flows of goods which mainly move between the urban areas, forming the logistic corridor.
- The goods enter and leave the system through well-known access nodes.
- Different constraints (spatial, economical, political, or ecological) act over the system.
- There are numerous and heterogeneous actors (importers, exporters, freight forwarders, logistic providers,...). Their behaviours and interactions with each other allow to organise the flows of goods. They are auto-organised.
Figure 1: Each actor manages a part of the flow
Problematic
- We want to understand how actors with different goals, are organised around all the logistic infrastructures to manage flows of goods despite all the constraints of the system.
- We are looking for an individual-based model which can reproduce the working of a logistic system thanks to the simulation.
- And then we could test different scenarios on this simulation to understand how the local decisions impact the system.
A Complex System Approach
We can perceive logistic systems as complex and we will use the concepts of the complexity science to model such a system.
- A Multi-agent approach : we model the numerous and heterogeneous actors and infrastructures by agents with their own local behaviours and properties.
- A multi-scale approach : we want to observe how the macro properties of the system emerge from these local properties and behaviours.
Model
A model in two main parts
- Each actors and logistic structures from the reality are modelled as reactive agents (individual-based model) :
- They have defined rules about how they can interact with each other and how they must behave.
- Agents bring flexibility since they can be adapted to different logistic system.
- A dynamic graph represents the interactions between the agents.
- The transportation network :
- It is made of dynamic sub-graphs in order to integrate multi-modality.
- Vehicles move over the network and leave a dynamic trace on their way in order to represent the traffic's evolution.

Figure 2: Model representation
Implementation
The implementation
- We implemented the model as a step-by-step simulation into the agent-based simulation platform GAMA.
- We use real data on the Seine axis to check its validity and to make measures.
- The Seine axis is mostly represented by the road (around 90% of the traffic is by road).
- The implemented agents:
- Final consignees: consume stocks and choose logistic providers.
- Logistic providers: build and manage supply chain to outsource stocks.
- Warehouses: spread over territory, they provide storage surface.
- Providers: they play the role of access nodes to the territory.
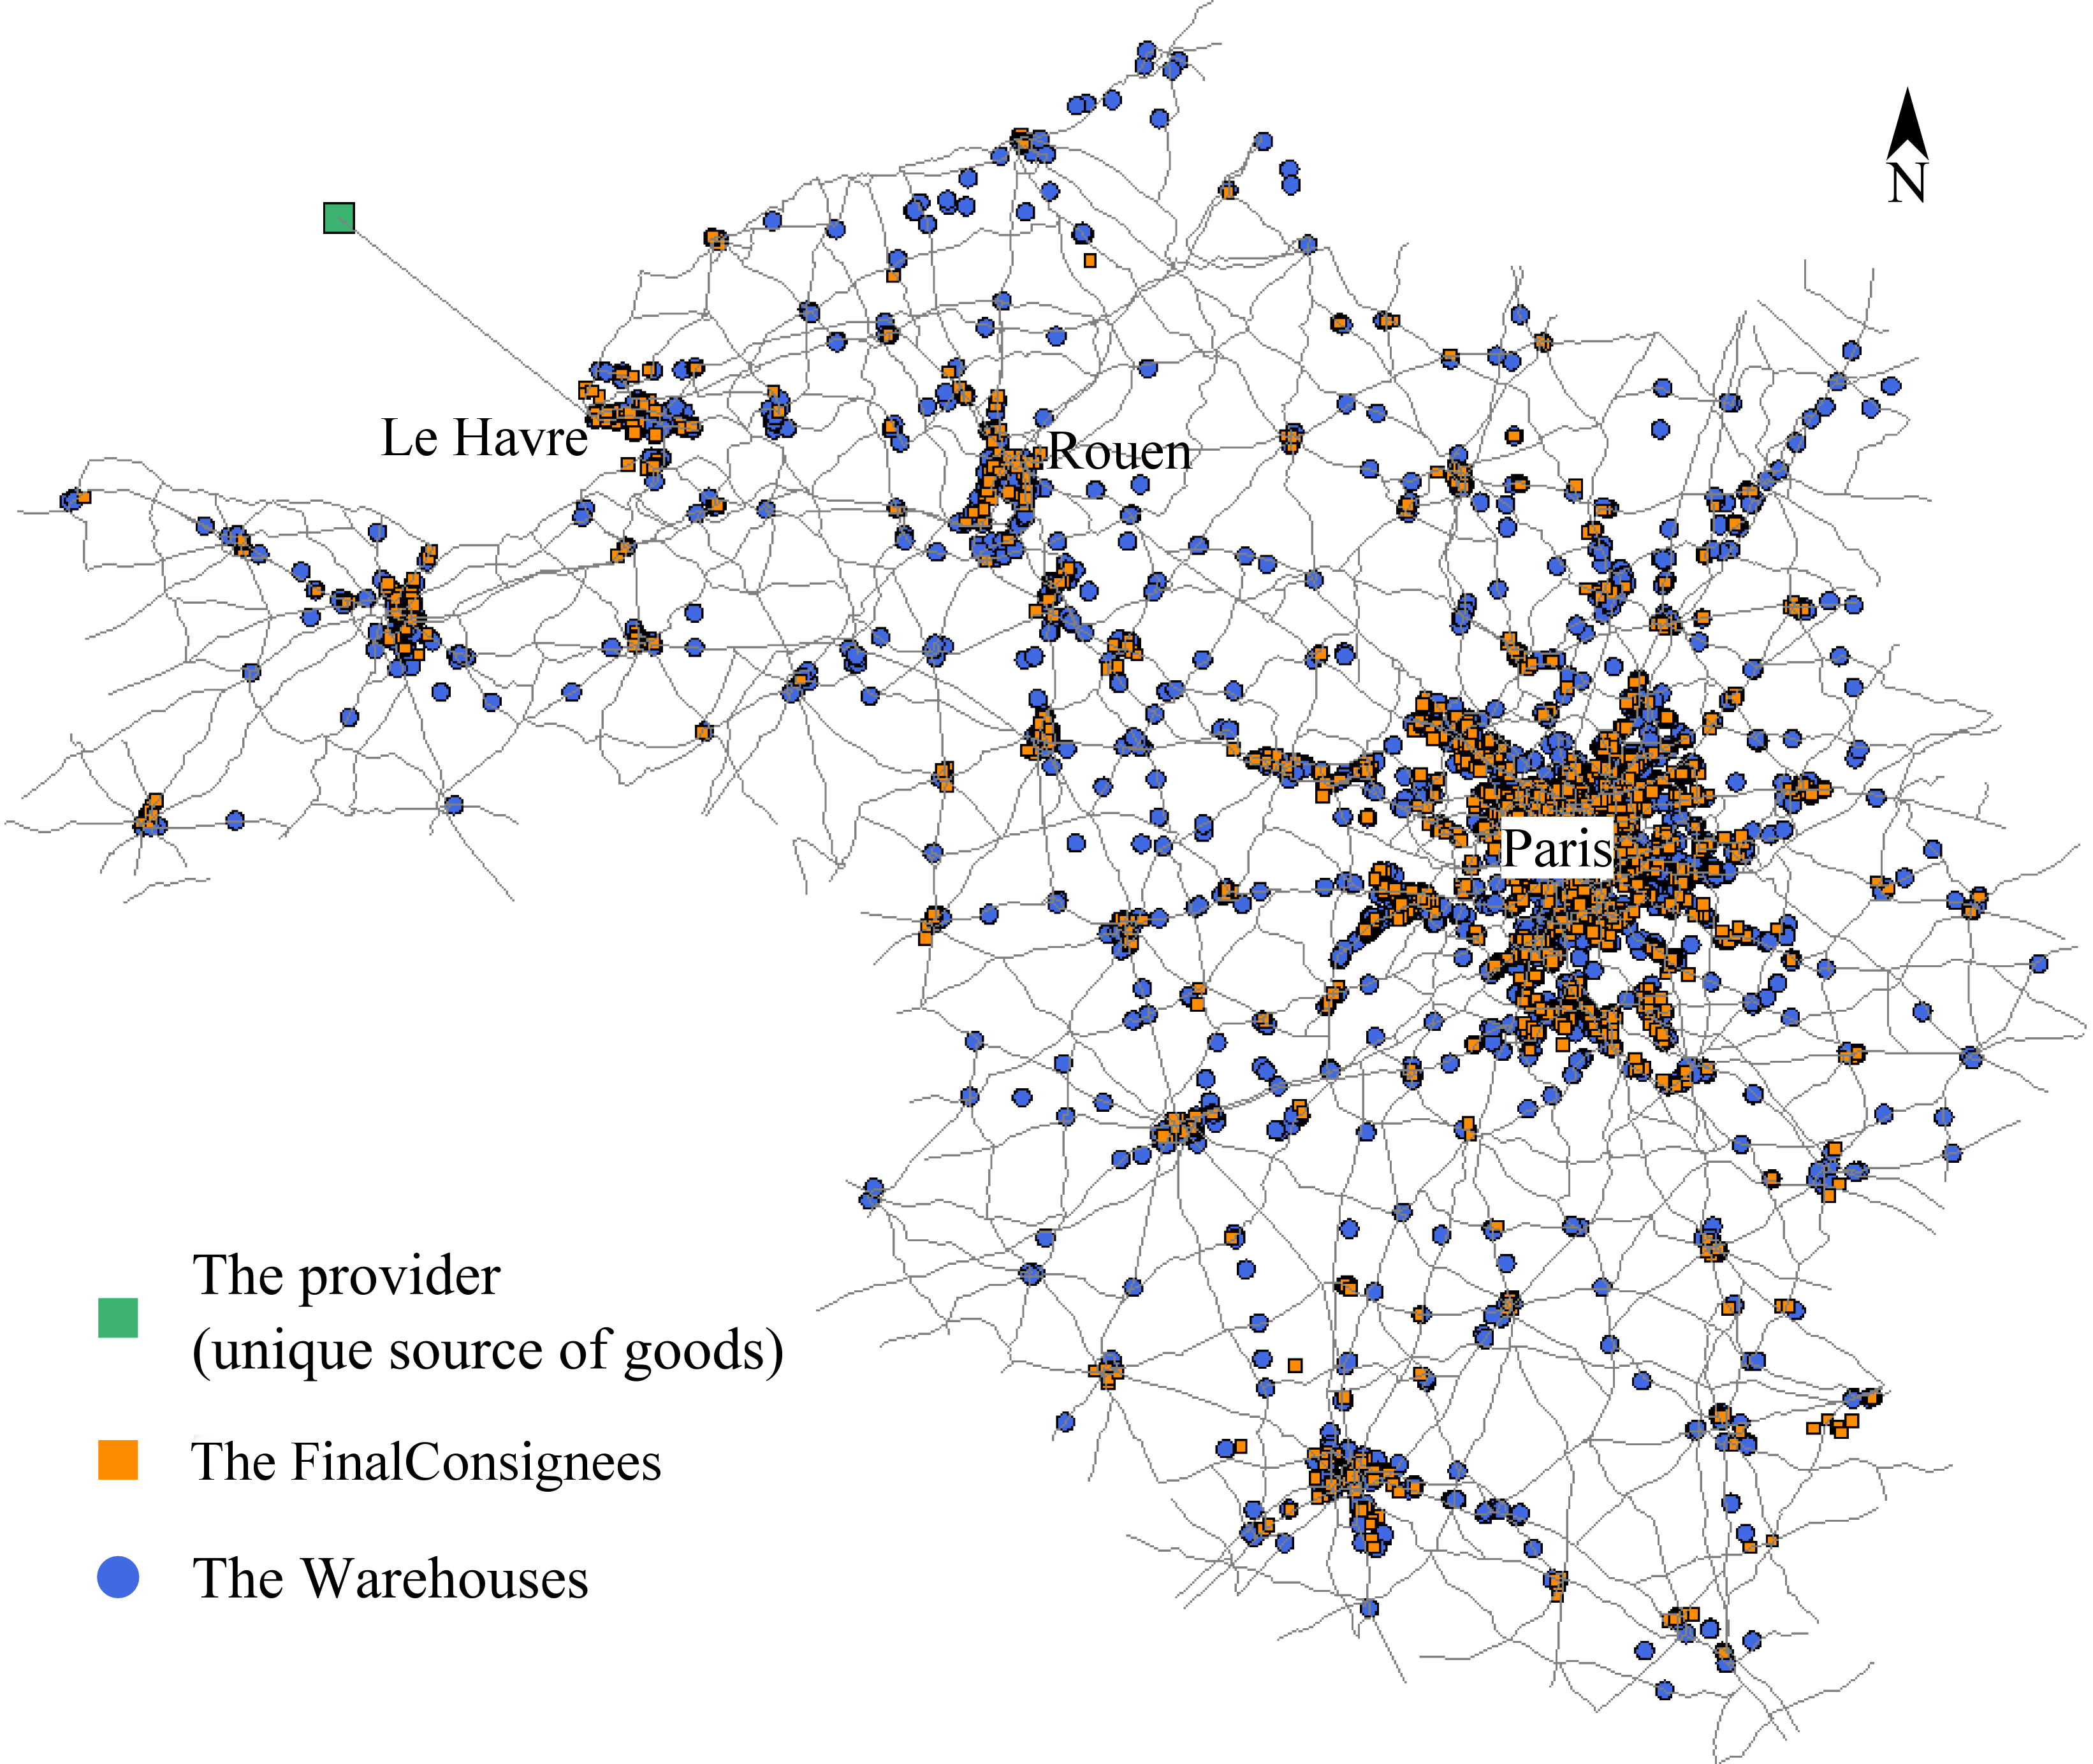
Figure 5: the territory and some agents of the simulation
Configuration and analysis
How to configure the simulation?
- The input data: the transportation network, the position and properties of each agent,...
- We can set locally the consumption of the population.
- We can set the restock strategy of logistics providers.
- Logistics providers can use different strategies to build supply chains.
- ...
What can be analysed?
- Observe the effects of disrupting events (such as road accidents).
- Highlight paths with the highest values of traffic.
- Detection of spatial cluster (logistic areas) thanks to neighbourhood graphs.
- Measure accessibility of agents thanks to Schimbel's index.
- Measures of logistics performances: time to deliver goods and number of stock shortages. These measures can be computed for each agent, for regions, or for the whole system.
- ...
Results
How do restock strategies affect stocks shortages?
How do best strategies emerge from local decisions?
Figure 2: Strategies adoption
Conclusion
To sum up
- Logistic systems can be seen as complex systems.
- We used an agent based model and dynamic graphs to represent such a system.
- It brings the possibility to represent the dynamics of such a system and the adaptability to different logistic systems.
- The model has been implemented on GAMA and we can experiment it on the Seine axis.
- We can observe the effect of different strategies adopted by agents and how the best ones emerge from local decisions.
Perspectives
- We would like to implement new measures of logistic performance based on cost in order to observe the competition between Le Havre and Antwerp.
- We want to implement new disrupting events in order to observe how the agents restructure their organisation.
- We want to study the interaction network in order to detect special communities of actors.
Thank you for your attention !
Any questions?
thibaut.demare@univ-lehavre.fr