Thibaut Démare - LITIS
thibaut.demare@univ-lehavre.fr
thibaut.demare@univ-lehavre.fr
An Introduction to GnuPlot
March 29th, 2016
An Introduction to GnuPlot
Thibaut Démare
LITIS - Université du Havre
March 29th, 2016
Overview
- What is GnuPlot and When do You Need to Use it?
- The main commands
- Example
- Plot it online!
What is GnuPlot and When do You Need to Use it?
What?
- GnuPlot allows to generate 2D and 3D plots of functions and data.
- It is a command-line program.
- You can run it on Windows, Mac or Linux and it is free.
When?
- When you need something very specific.
- When you need to automize the process.
The main commands
The First Commands to Know
set terminal [options]
it defines the output format.set output [options]set xrange [options]
it defines the ranges of the function to plot.set yrange [options]
the main command which draws the function or data.plot [options]
The "plot" Command
to plot a classic math function.plot sin(x)
to plot data from a CSV file.plot "data.txt" using 1:2
a more customized version.plot "data.txt" using 1:5 title 'My data' with linespoints linewidth 2 pointinterval -100 pointtype 13 pointsize 1 linecolor rgb "#228B22"
Example
Example
# First, we tell to gnuplot what it the output
# Here, it is a SVG file called "output.svg", with a "times new roman" font
set terminal svg size 1473,824 enhanced fname 'Times New Roman' fsize 24 butt solid
set output 'output.svg'

# We define where to place the legend
set key inside bottom right
# Put a title to the x-axis
set xlabel 'Time'
# And a title to the y-axis
set ylabel 'Number of Logistics Service Provider'
# And the main title
set title 'Strategies Adoption'
# Eventually we plot the four curves
plot  "data.txt" using 1:5 title 'Strategy 1' with linespoints lw 2 pi -100 pt 13 ps 1 lc rgb "#228B22",\
      "data.txt" using 1:4 title 'Strategy 2' with linespoints lw 2 pi -100 pt 9 ps 1 lc rgb "#FF8C00",\
      "data.txt" using 1:2 title 'Strategy 3' with linespoints lw 2 pi -100 pt 11 ps 1 lc rgb "#003B6F",\
      "data.txt" using 1:3 title 'Strategy 4' with linespoints lw 2 pi -100 pt 7 ps 1 lc rgb "#CC0000"
Example
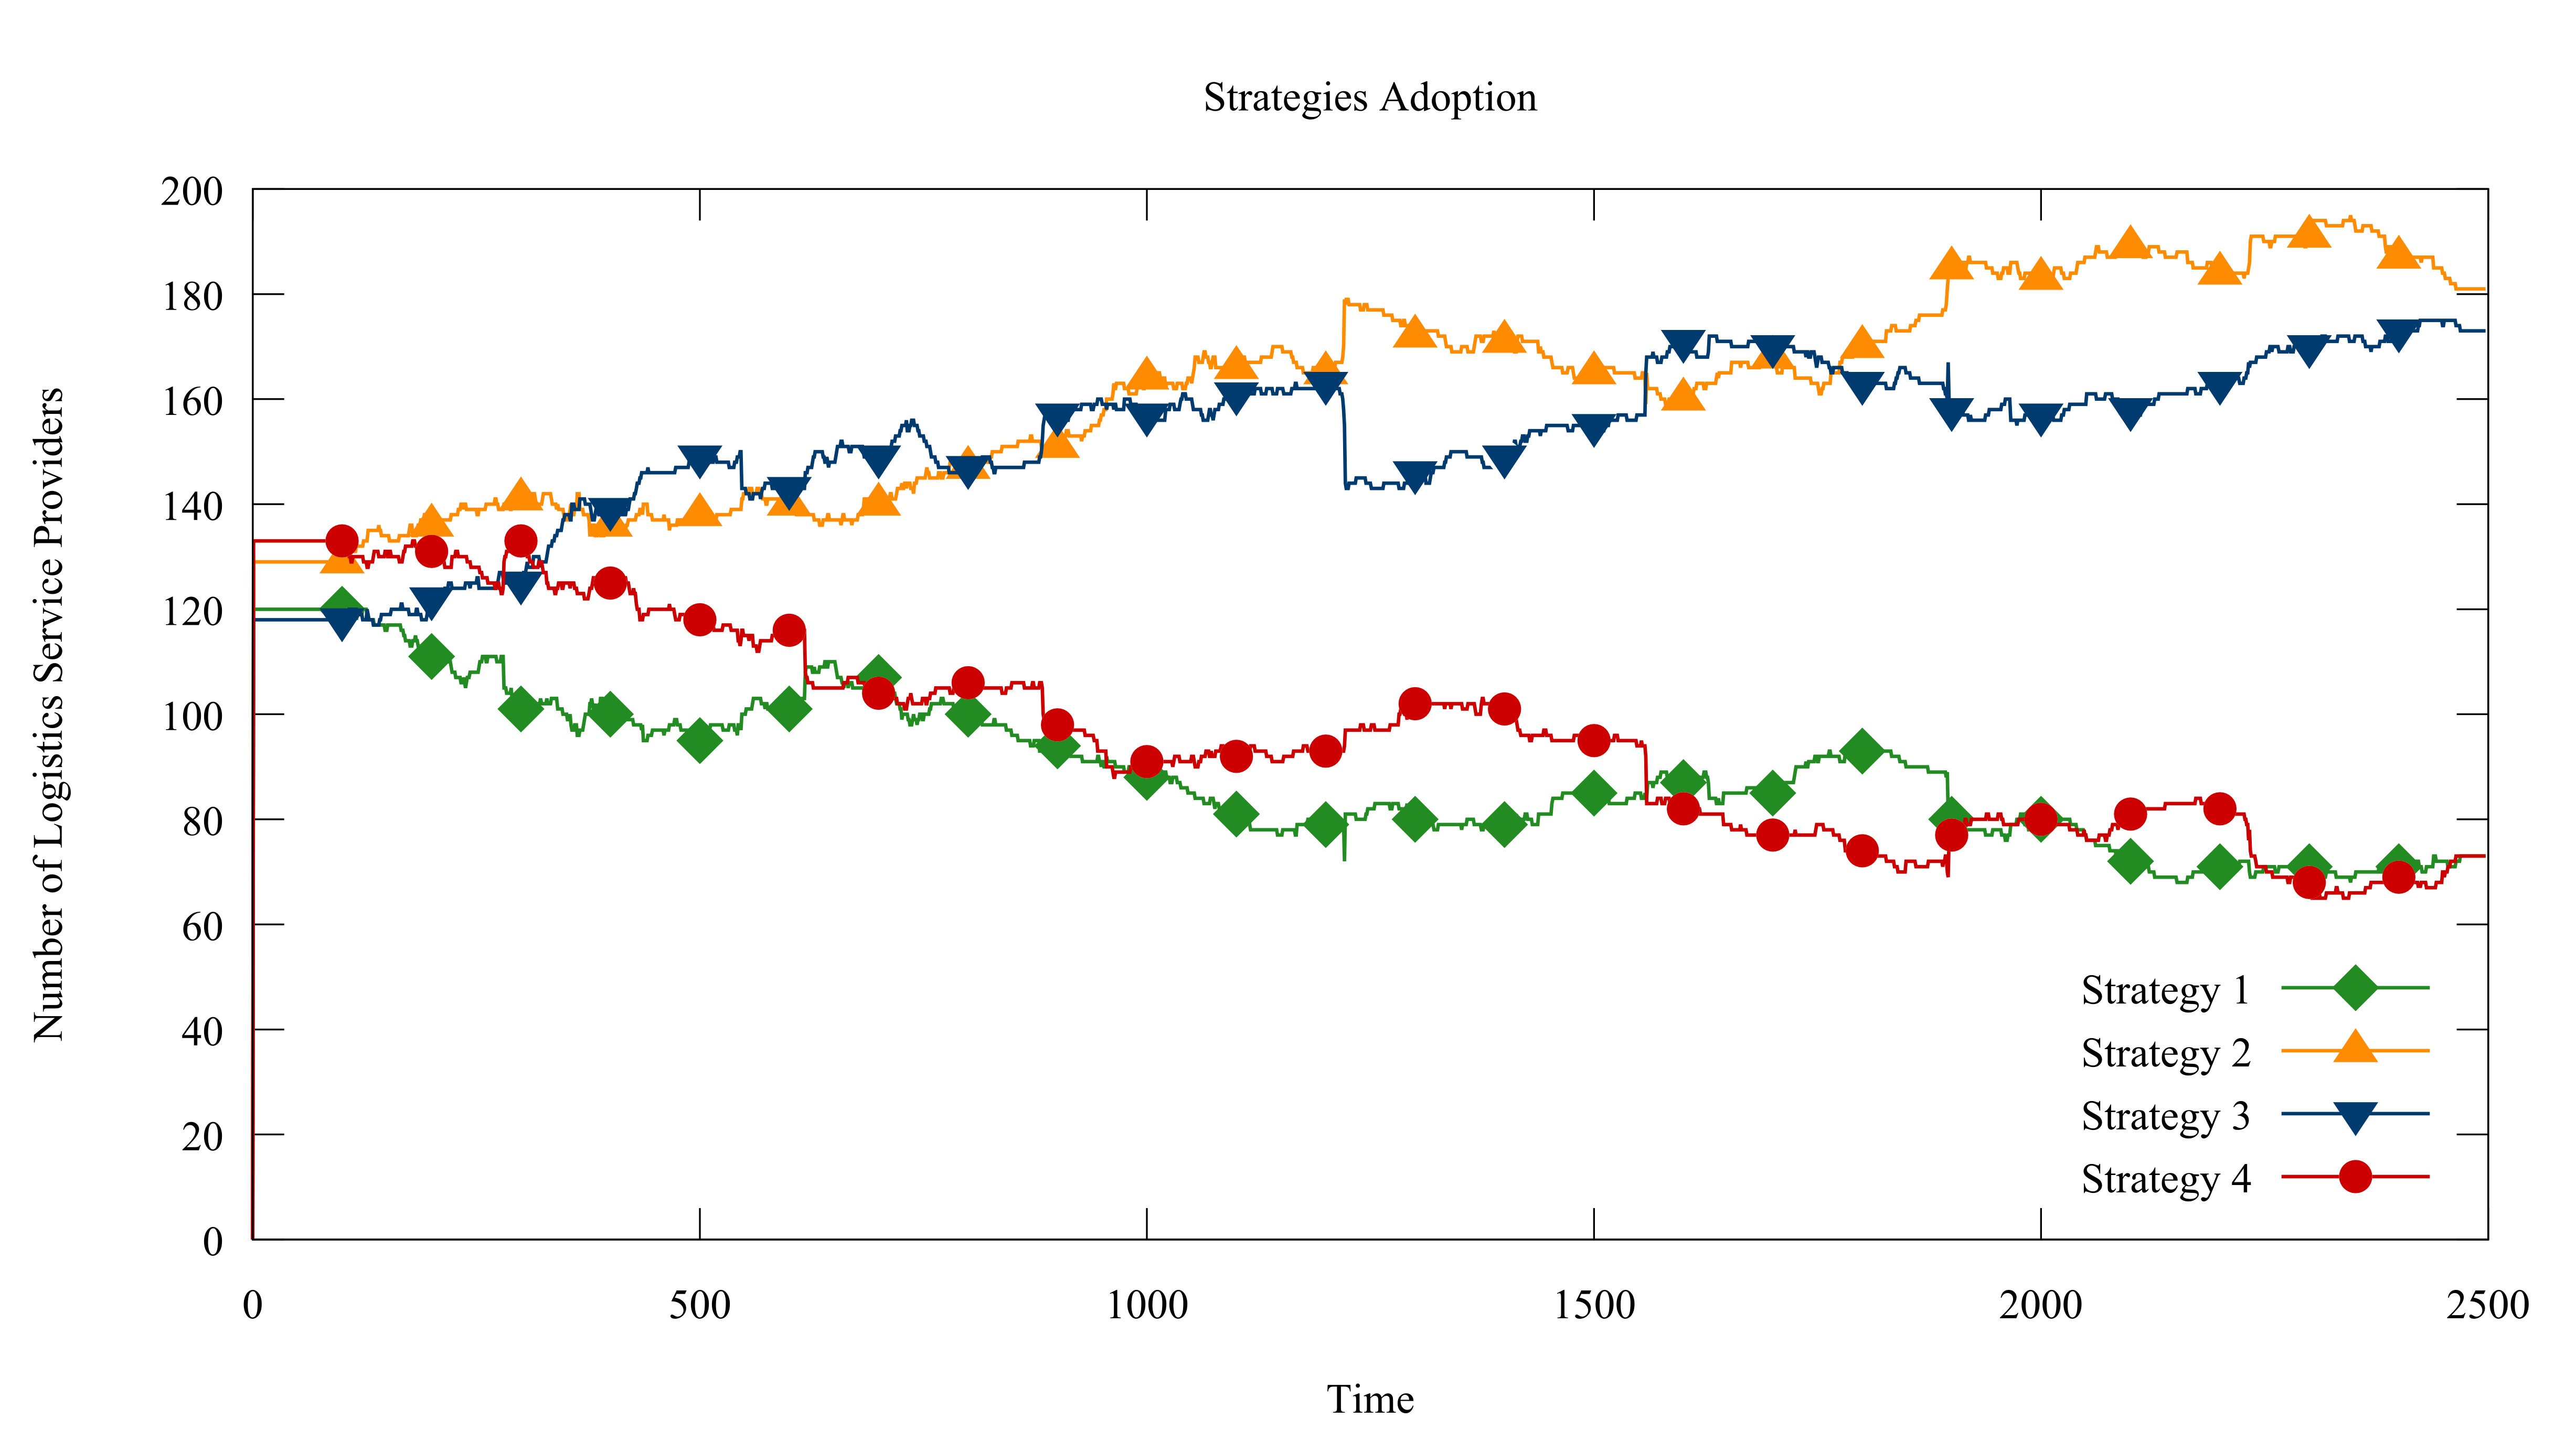
Figure 1: The output
Some links
Some links
- Gnuplot's official website.
- Gnuplot it online!
- Desmos : It is not Gnuplot, but it is useful.
Thank you for your attention !
Any questions?
thibaut.demare@univ-lehavre.fr